
All enterprises are under constant pressure to reduce costs, including life science operations. Operations Directors are constantly searching for ways to increase equipment utilization and decrease costs. They also need data on equipment utilization to determine if equipment should be decommissioned, relocated, added or moved. Do they really need to pay for the annual PM for the centrifuge tucked in the corner of the lab? Does it really get a lot of use? Having reliable utilization data makes these decisions easier.
In the case of cold storage, it would be nice to understand how frequently each ULT freezer, sub-zero freezer and fridge is really being used. If a lab is moving to a new location do they really need all that cold storage or they could get away with one or two fewer ULT freezers?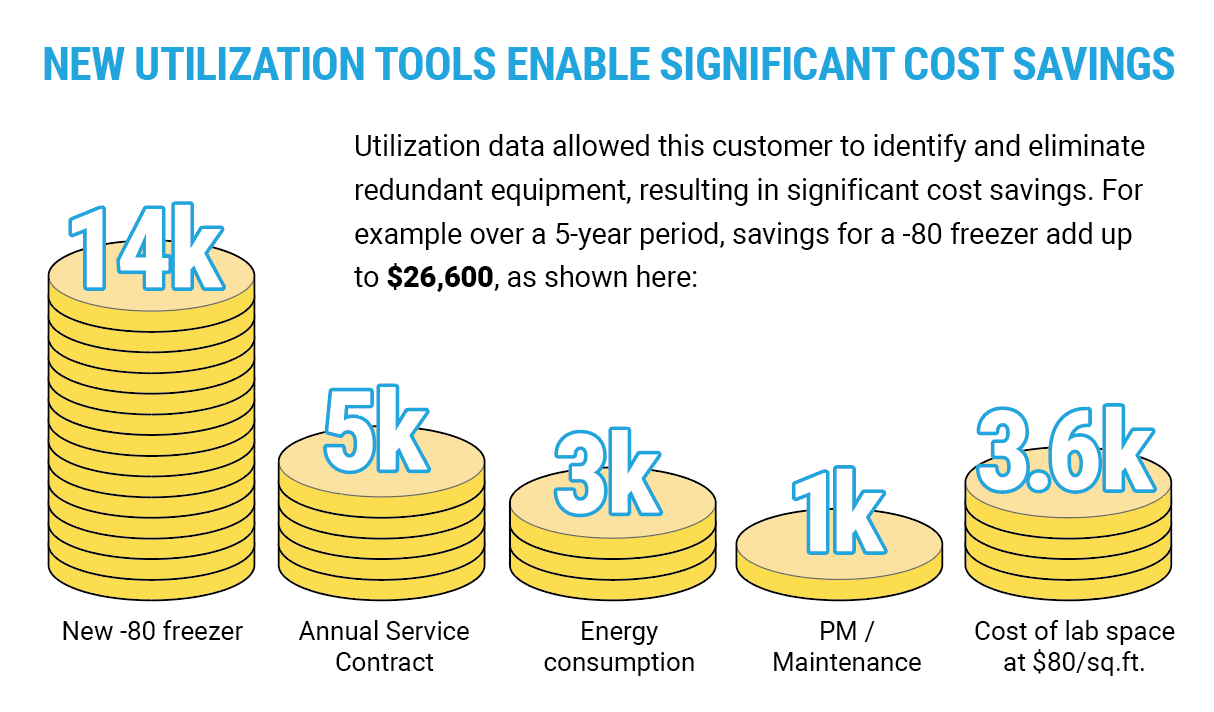
An Element-T Internet of Things (IoT) temperature sensor that can track the utilization of this equipment by monitoring door open events can make these questions much easier to answer. In one study 60 freezers were studied over a two month period using Element-T sensors. Door open events can be seen as a rise in the temperature.
Tracking freezer temperature with an Element-T usually produces a graph like this for a -80 degree freezer. The cycles are caused by the compressor turning on and off.

If the door is opened the temperature rises and this can be seen on the temperature graph.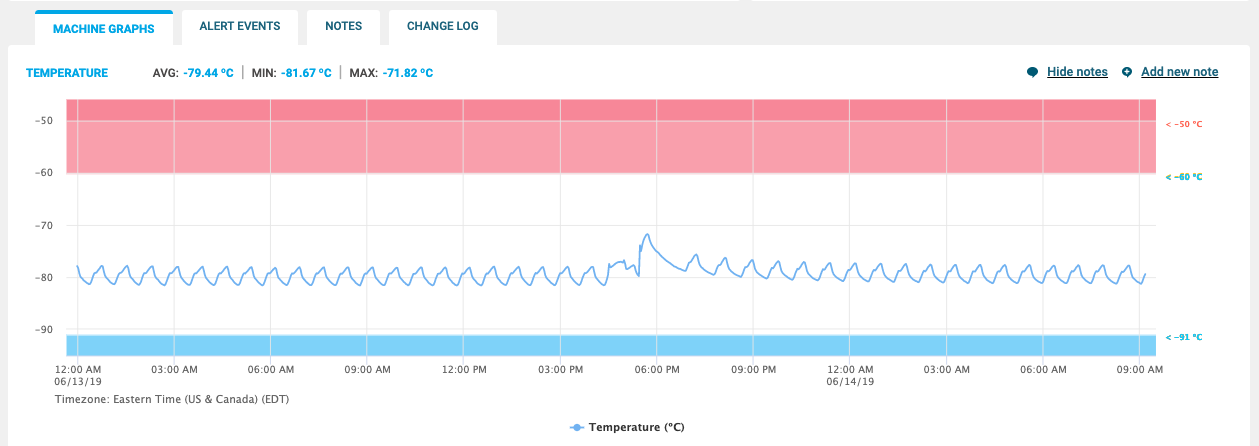
Using data like this it’s straightforward to see how many door open events happen with each freezer or fridge during a certain time period. We did a study at a customer site to find out.
Over the course of the six month pilot, 20 Element-T sensors were installed in three, two-month batches for a total of sixty freezers throughout the facility. This report summarizes the usage statistics for these freezers.
Freezers are categorized into three types based on the temperature setting: -80C, -20C, and +4C.
| Freezer/Fridge Operating Temp (C) | Number of these assets |
|---|---|
| -80 | 20 |
| -20 | 21 |
| 4 | 18 |
Table 1: Freezer Distribution
Using Elemental Insights to detect door open events, usage statistics are calculated.
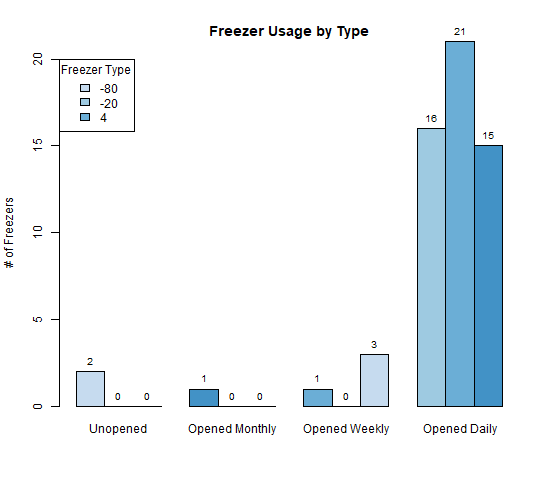
Figure 1 shows that most freezers were used regularly. However, two of the -80C freezers went unopened during the two month period and another was only opened an average of once per month. Now this doesn’t prove that these two freezers were not useful to the organization, but it certainly raises the possibility that they are superfluous and could be eliminated.
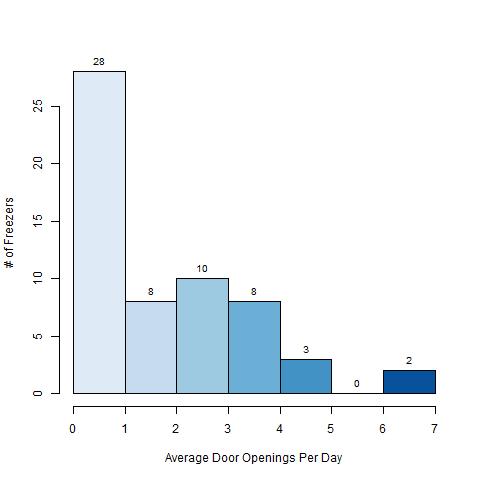
Figure 2 shows that the typical freezer was opened daily, while some freezers on average were opened as many as 7 times a day.
If an Operation’s director had this sort of information available to them, they could investigate the utilization of these two freezers and decide whether to decommission them or not. If they decide, for instance, to move a -80 freezer from this lab (rather than purchase a new one) to a new lab being built how much money might that save them? Over a five year period it can be pretty significant.
Cost estimates:
|
Item |
Annual Cost Savings |
Total over five years |
|
New -80 freezer |
$14,000 |
$14,000 |
|
Service Contract |
$1000 |
$5000 |
|
Energy consumption |
$600 |
$3000 |
|
Annual PM/maintenance |
$200 |
$1000 |
|
Cost of lab space $80/square foot |
$720 |
$3600 |
|
Total |
$17,520 |
$26,600 |
This is just one example of using utilization information to save money. Presently the Elemental Machines network provides utilization information about door opens on cold storage equipment and incubators. We are constantly connecting our sensors to new pieces of equipment, so check in to see what we are able to measure next!
To learn more about equipment monitoring with IoT, DOWNLOAD OUR HANDBOOK.